NOAA Earth System Research Laboratory

I happened across NOAA’s Earth System Research Laboratory: Physical Science Division’s web site today.  Looks to have quite a bit of interesting content.   Among other things, their Research Highlights section includes pages on Interpreting Climate Conditions, Atmospheric Rivers [1], Improving Hurricane Intensity Forecasts, and Twentieth Century Reanalysis [2].

Notes:

  1. Atmospheric rivers (AR) are “relatively narrow regions in the atmosphere that are responsible for most of the horizontal transport of water vapor outside of the tropics… On average, about 30-50% of annual precipitation in the west coast states occurs in just a few AR events, thus contributing to water supply… A strong AR transports an amount of water vapor roughly equivalent to 7.5–15 times the average flow of liquid water at the mouth of the Mississippi River.”
  2. “Using a state-of-the-art data assimilation system and surface pressure observations, the Twentieth Century Reanalysis Project is generating a six-hourly, four-dimensional global atmospheric dataset spanning 1871 to 2012 to place current atmospheric circulation patterns into a historical perspective.”

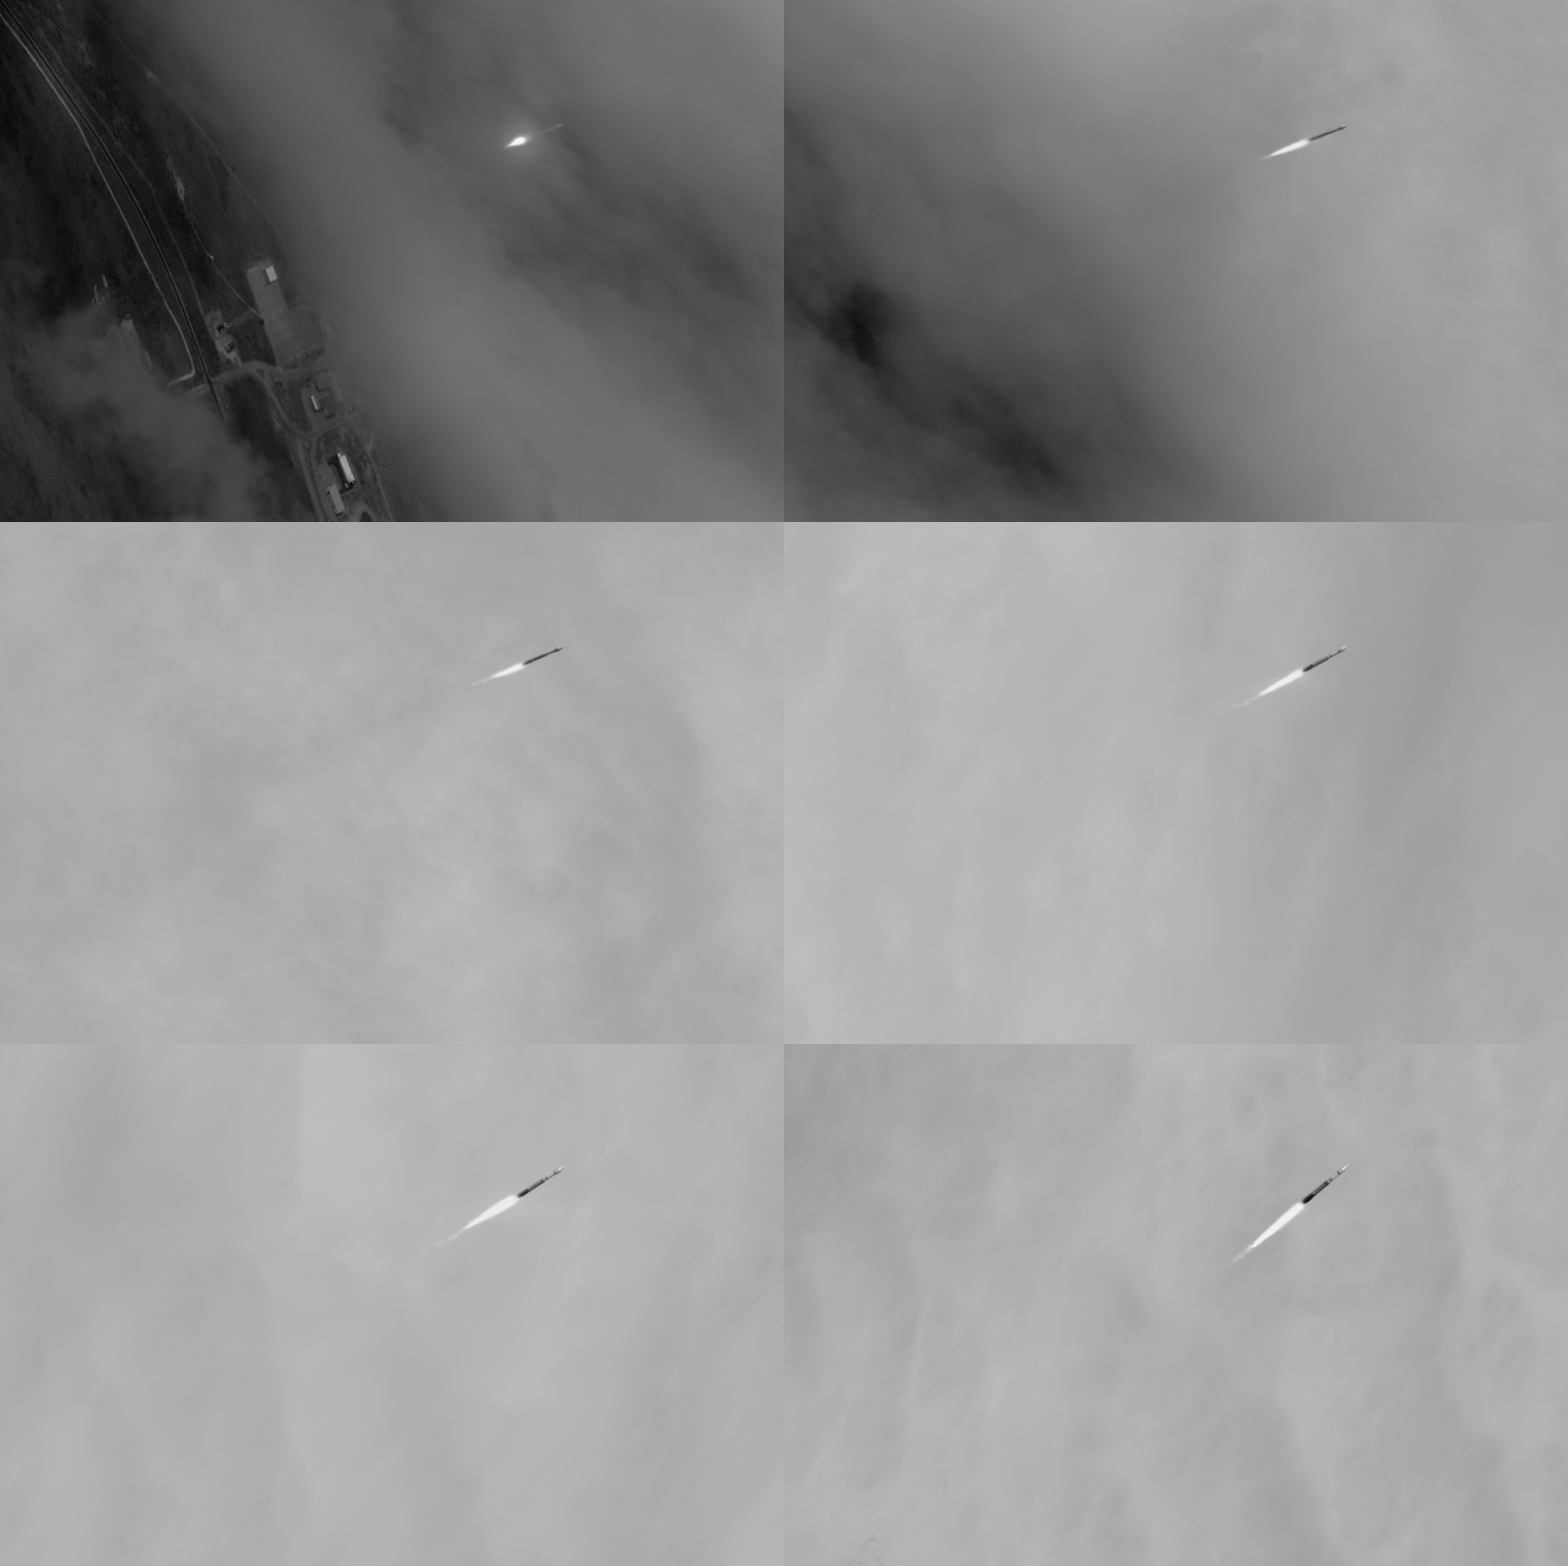
WorldView-3 launch as seen from WorldView-1

A week and a half ago I noted the WorldView-3 launch.   Well, the owners of WV-3 had the presence of mind to think, “Hey, wouldn’t it be neat to record the launch of WV-3 from one of our other satellites?”  And so they did:

WV-3-Launch-Sequence-T+17-to-T+95-900x6001

From the company’s blog:

WorldView-1 caught this sequence of images of the WorldView-3 Atlas V launch vehicle as it launched from Vandenberg AFB in California last Wednesday. The rocket was really moving; by the time of the last frame, WorldView-3 was traveling at just over 1,000 mph at an altitude of 49,000 feet. WorldView-1 shot these while moving at 17,000 mph at an altitude of 307 miles above the ground, at a distance of between 500 and 750 miles from the rocket.

WorldView-3 launched

The WorldView-3 satellite launched from Vandenberg AFB on an Atlas V rocket:

What’s WorldView-3, you ask?  Well, if you use Google Earth then you’ve seen imagery from WorldView-2.  WorldView-3 will provide higher spatial resolution imagery, 30 cm vs 50 cm, as well as imagery in additional spectral bands which can support science missions.  From Ball Aerospace, who built the satellite:

WorldView-3 also features the first atmospheric sounder DigitalGlobe will fly in space. The Ball-built Cloud, Aerosol, Water Vapor, Ice, Snow (CAVIS) atmospheric instrument will enable WorldView-3 to collect scientific data based on ground reflection by correcting images for atmospheric interference.

The specs are pretty amazing.  And some propaganda promotional materials from DigitalGlobe here.   (Note the not-so-subtle smackdown of Skybox.)  Like I wrote above, it’s pretty amazing.   Unlike Landsat, you won’t be able to get the imagery for free but, hey, you get what you pay for;-)  Landsat data is good for it’s intended purpose but I think it’ll be really easy to get spoiled on WV-3 imagery.

ADDENDUM:  Most of us think about the visible spectrum – red, green, blue.  If you’d like to learn about what longer wavelengths (too red for the human eye to see) are good for there’s a nice not-to-technical summary here.

MATLAB!

I’m now the proud owner of a MATLAB Home license:

MATLAB® is a high-level language and interactive environment for numerical computation, visualization, and programming. Using MATLAB, you can analyze data, develop algorithms, and create models and applications. The language, tools, and built-in math functions enable you to explore multiple approaches and reach a solution faster than with spreadsheets or traditional programming languages, such as C/C++ or Java.

Why did I do it?  1)  I want to be able to tinker at home,  2) the license for home use is only $150, 3) IDL, my primary programming language for nearly 20 years now, doesn’t offer home use licenses (Commercial licenses for MATLAB and IDL each run about $2k.), and 4)  MATLAB has become the lingua franca of technical computing.

IDL is great for algorithm development and I like it better than MATLAB for image display – not to mention that in the head-to-head comparisons I’ve done custom algorithms run 2-3x faster in IDL than in MATLAB – but outside of a few niche areas hardly anyone knows it.   I’m finding that’s increasingly an issue at work.  At a minimum I need to be fluent in both.

When I first started using MATLAB at work the analogy I made was switching from French to Spanish as your primary language.  (I don’t speak either but the analogy sounded appropriate.)  The structure of my code would be fine but there’d be tons of grammatical errors.   (Row major vs column major still gives me fits, as do matrix indices running 1 to n as opposed to 0 to n-1.  Oh, and the difference between what you get back from their respective 2D FFT functions?  It took me two weeks to discover that the difference in convention mattered for what I was doing and then to get the MATLAB-IDL mapping right.)

Continue reading

Truth in Advertising: Weather Forecasting Edition

I check the NWS forecast every morning.   I also check the “Forecast Discussion” section – where the forecasters give the details behind the forecast on the main page – because sometimes there’s something like this:

.NEAR TERM /UNTIL 6 PM THIS EVENING/...
***TODAY/S FORECAST IS OF VERY LOW CONFIDENCE GIVEN CONSIDERABLE
  MODEL DISAGREEMENT***

PRETTY REMARKABLE MODEL DISAGREEMENT FOR A 12 HOUR FORECAST.  THE
MODELS ARE STRUGGLING WITH A PLUME OF TROPICAL MOISTURE STREAMING
NORTHWARD FROM THE MID ATLANTIC STATES. WHENEVER YOU ARE DEALING
WITH TROPICAL MOISTURE AND VIRTUALLY NO THERMAL GRADIENT...ITS
GOING TO PLAY HAVOC WITH COMPUTER MODEL FORECASTS AND PLACEMENT OF
QPF.

AT THIS POINT...THE BEST THING WE CAN DO IS KEEP THE THEME OF THE
FORECAST GOING FROM THE LAST FEW DAYS...NOT JUMPING ON WILD MODEL
SWINGS...

Three cheers for truth in advertising.  Admission of uncertainty is a good thing.

Continue reading

Wrong.

duty_calls

(The original working title for this post was “Supposed Seasoned Veteran Makes Rookie Mistake”.)

I needed educate myself on how people retrieve water vapor column from satellite-based spectral measurements.   I found what I was looking for – see, e.g., The MODIS Near-IR Water Vapor Algorithm and more recent versions of that document.   I also encountered this, IR Expert Speaks Out After 40 Years Of Silence : “IT’S THE WATER VAPOR STUPID and not the CO2″.  If you’re not intimately familiar with the details of the science being discussed the “It’s the water vapor, stupid!”  argument sounds very informed, very sensible.  But if you do understand the science… not so much.

Continue reading

MIT Tech Day 2014: The Future of Planet Earth

Videos of this year’s speakers here.

The talks:

  • “Earth Under Stress: Thinking differently about climate research” — Kerry Emanuel ’76, PhD ’78, Cecil & Ida Green Professor of Atmospheric Science:

For the past half century, scientists have been at work on amassing an impressive array of data and models to understand the stresses placed on the planet by an accelerated rate of climate change. This talk will assess the current understanding of the major climate processes and propose new directions for climate research.

  • “Lessons from the Landscapes of Earth and Other Planets” — Taylor Perron, Cecil and Ida Green Assistant Professor of Geology:

Landscapes are open archives of planetary history. Looking elsewhere in the solar system and into Earth’s past shows that some landscape features are surprisingly robust. But the specific forms they take on appear to depend on life and, more recently, on human impacts. This talk will explore clues left in planetary landscapes and the light they shed on the state of the planet.