
There’s been much speculation about the root cause of Clinton’s loss, e.g., white working class turnout for Trump? Clinton unable turn out the “Obama coalition”? For example, Nate Cohn offers an analysis in the NYT, “How the Obama Coalition Crumbled, Leaving an Opening for Trump“. There’s a section in his post, “It Wasn’t Turnout” (that caused Clinton to lose). With respect to WI, MI, and PA, the three Clinton “firewall” states which went for Trump and essentially won him the election, that’s BS. Just look at the number for votes for the Democratic and Republican candidates over the last five elections.
Wisconsin:

Republican up 147k votes from 2008; Democrat down 295k.
Michigan:

Republican up 231k votes from 2008; Democrat down 604k.
Pennsylvania:
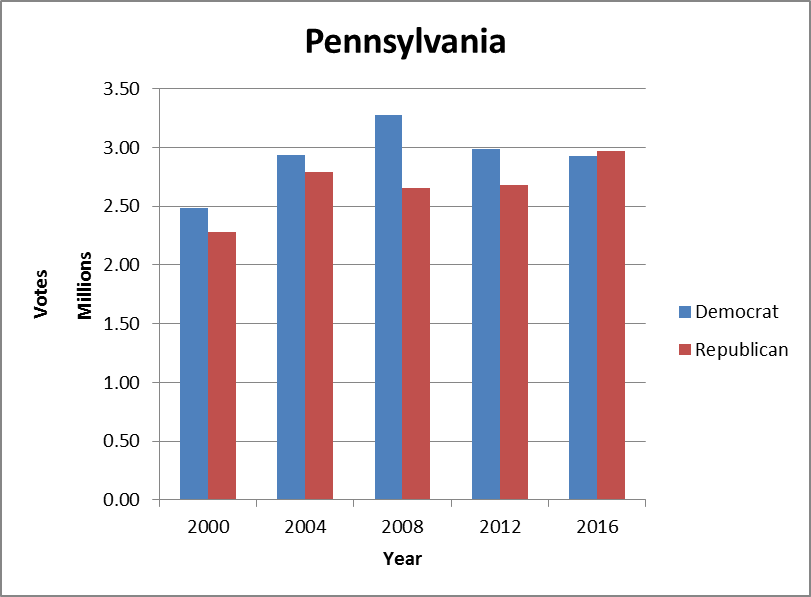
Republican up 315k votes from 2008; Democrat down 350k.
In all three of those the reduction in number of votes for the Democratic candidate was greater than the increase in the number of votes for the Republican.
Although Clinton won there, the trend was similar in Minnesota:

Republican up 48k votes from 2008; Democrat down 206k.
Now look back to 2004: Bush vs Kerry. The total population has increased by about 10% since 2004 (and I’m guessing the voting age population has increased by a similar amount). Trump pulled fewer votes that Bush did in 2004 in WI, MI, and MN. That’s hardly a ringing endorsement of him. Same with Clinton. She underperformed Kerry in WI and MI and was about even in PA. That’s painful. My takeaway isn’t that Trump popular, it’s that Clinton wasn’t. Democrats would do well to ask former supporters why they didn’t turn out this year – and to be willing to consider that the reasons may run deeper than emailgate, Russian hacking, Benghazi, etc.
PS Out of curiosity, I also looked at the D and R trends in Virginia. In contrast to the states above, VA has trended blue since 2000:
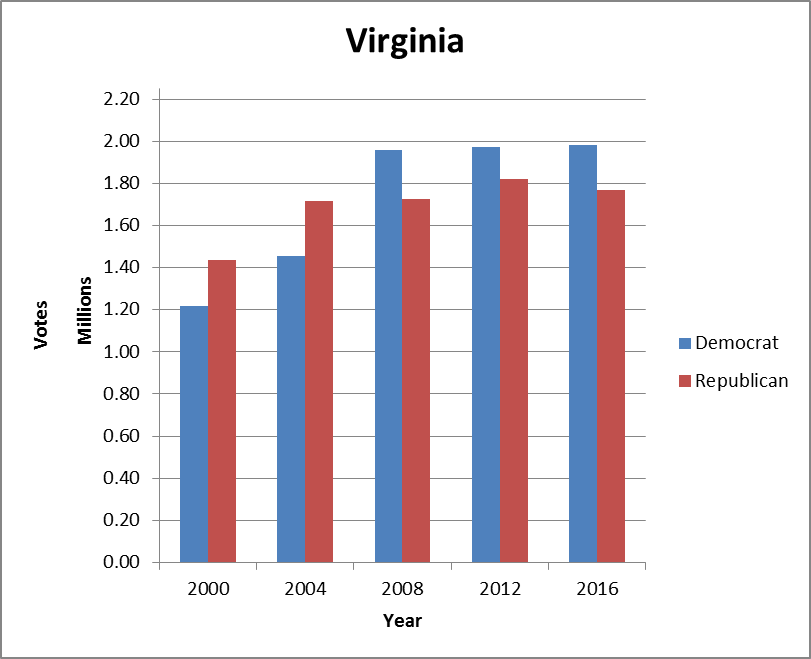
PPS I pulled the numbers in the charts above from Wikipedia.