
The figure below shows where incoming solar energy goes, i.e., how much is reflected and absorbed by the air in the atmosphere, by clouds, by the Earth’s surface, etc., and what becomes of what’s absorbed. The disposition of solar radiation in combination with infrared (IR) emission from the Earth’s surface and the atmosphere are what govern planetary temperature and drive climate change. The numbers in the figure below are petawatts: 1 PW = 1,000,000,000 megawatts. For comparison, nuclear power plants generate on the order of 1,000 megawatts.
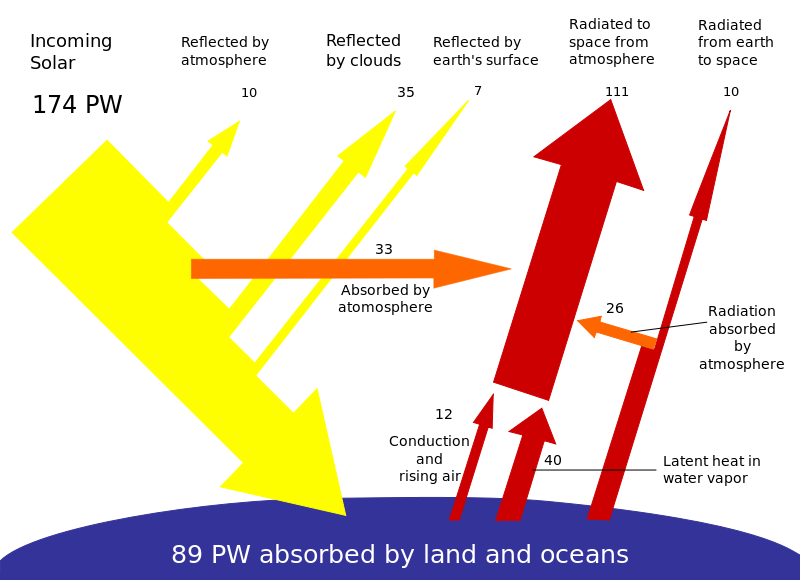
Looking at the numbers, you see that the biggest driver is radiation (emission of IR light) to space from the atmosphere. Also significant, but less so by at least a factor of three, are heating of atmospheric water vapor, reflection by clouds, and absorption by the atmosphere. We expect that the Earth’s temperature will be particularly sensitive to things (human activities and natural phenomena) which affect those processes. Increase in atmospheric carbon dioxide (CO2) concentration is particularly significant because it affects the Radiation to Space from Atmosphere mechanism. CO2 functions as a blanket which retains heat at lower altitudes.
I like the figure above but it can also be instructive to look at percentages, e.g., what percentage of incoming solar is reflected by clouds, such as shown here:
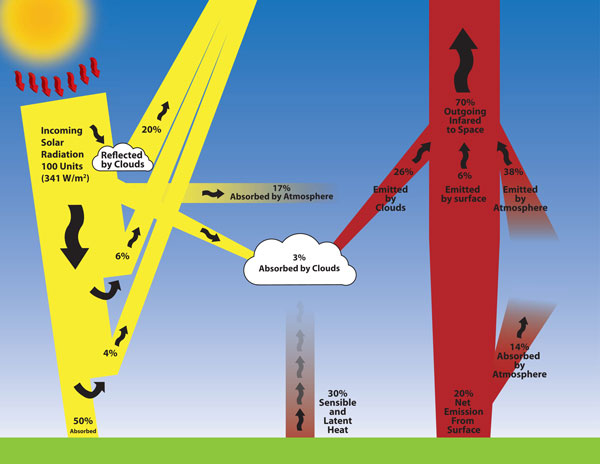
Same effects as in the first chart, just a different presentation. Again you see that outgoing IR radiation is the long pole in the tent. If you’re interested in the details, there’s an excellent primer on IR radiative transfer and how it affects planetary temperature here. (I’d say it’s suitable for people with a working knowledge – or at least a vague recollection – of undergrad physics.)
Here’s some context for the charts above from the IPCC:
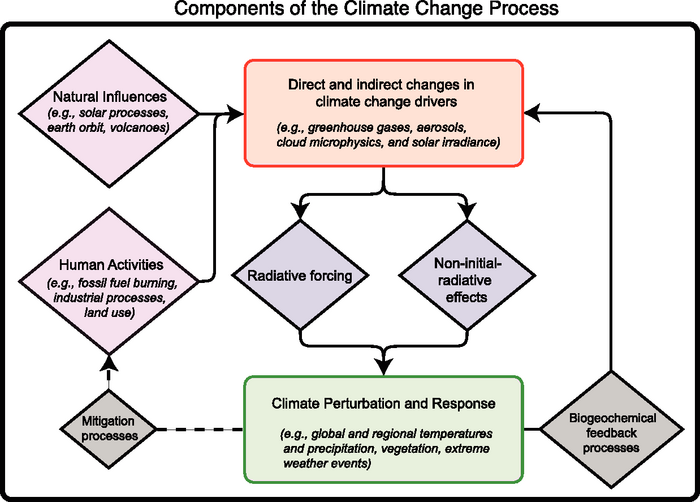
It’s instructive to look at how different atmospheric constituents affect radiative transfer (the “Radiative forcing” diamond above). For example, why do we care about CO2 more than water vapor? It’s easy to get bogged down in the details. To keep things simple for a general audience, it’s common to refer to “radiative forcing” and “climate sensitivity”. Climate sensitivity the predicted (long term) change in surface temperature of the Earth given the atmosphere and surface characteristics we have now  , where
  is a constant with units of deg C per (watt-per-square-meter) and
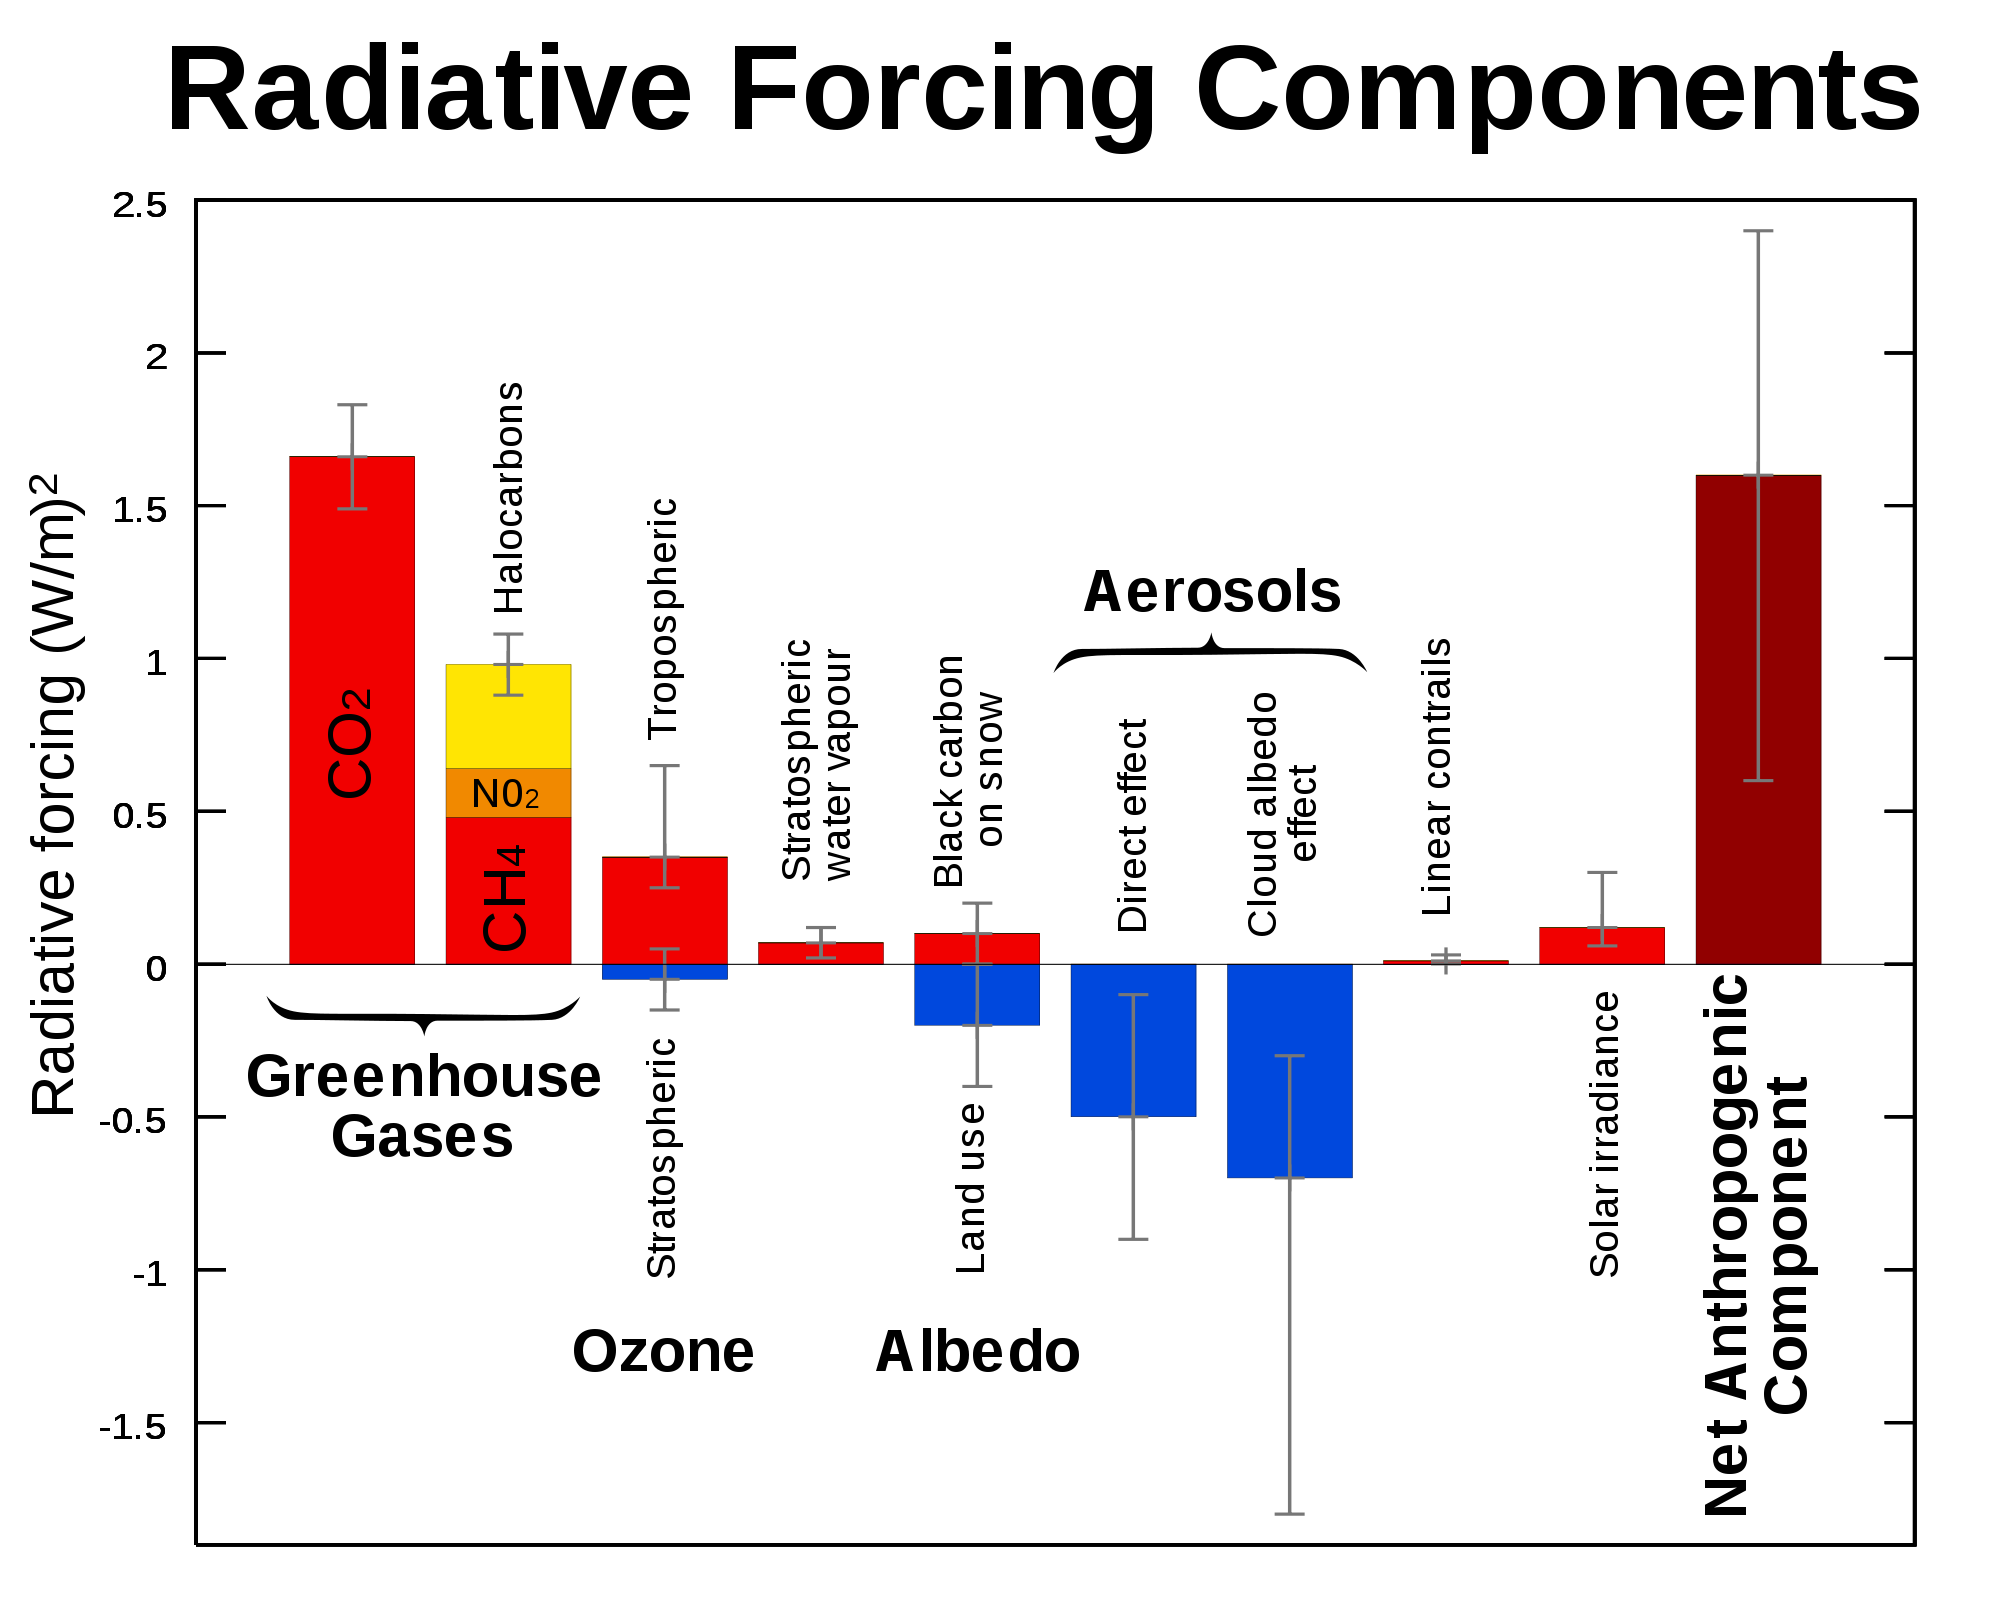
  is the forcing term in units of watts per square meter. (See here for more detail.) Here are the radiative forcing terms and their associated uncertainties for CO2, methane, halocarbons, ozone, aerosols (dust) as well as a few other things – atmospheric constituents and otherwise:
If we figure a value of 0.8 K/(W/m ) then we predict that the current the CO2 concentration will push the surface temperature up about 1.3 deg C relative to the year 1750; 1750 chosen as an arbitrary pre-industrial reference year. (There’s debate over the appropriate value of but the historical data suggest surface temps have increased ~1.4 deg C so 0.8 K/(W/m) seems reasonable.)
The figure above lists all significant contributions to radiative forcing. CO2 is clearly the long pole in the tent. It’s constructive to look at just the CO2 contribution to radiative forcing. Atmospheric CO2 concentration is now ~400 parts-per-million-per-unit-volume (ppmv). There’s considerable variation in predicted CO2 concentrations but a doubling of current levels appears well within the realm of the plausible. Here are some predictions of CO2 concentration provided by the Intergovernmental Panel on Climate Change (IPCC):
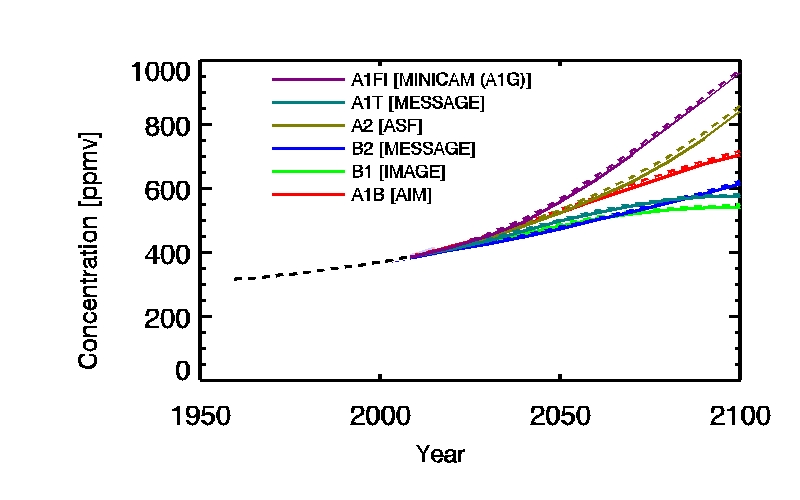
Given a significantly likelihood that atmospheric CO2 concentration may well double before the end of the century, it would nice to know  /
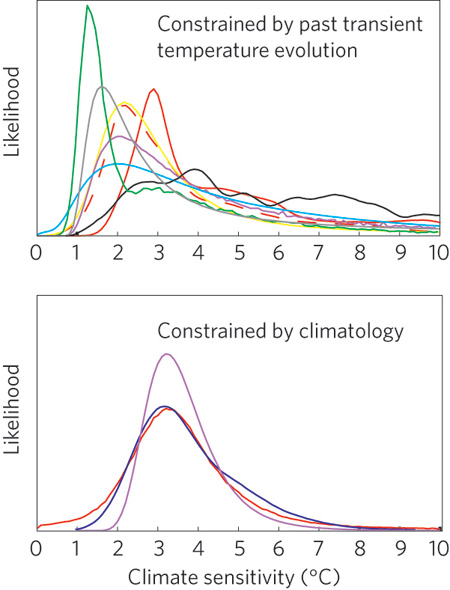
/ to get a sense of the implications. Well, here’s a representative range of predictions for increase in average surface temperature given a doubling of CO2 concentration. The y-axis is the (predicted) relative probability that the temperature will increase by the amount on the x-axis. Note the heavy-tailed distributions. I’m perhaps less disturbed by a highly probable increase of 1.5-3 deg (although that’s disturbing) than I am by the small but still significant probability of a >6 deg increase.
While there’s uncertainty in the details of how increasing CO2 concentration will affect land surface temperature, air temperature vs altitude, sea temperature (not to mention how local and non-local changes in temperature will affect weather patterns) we understand the radiative forcing effects of CO2 very accurately – note the uncertainty bars associated with the CO2 forcing term in the above chart. The uncertainty in CO2 forcing is a small fraction of the forcing term itself. From a science standpoint, CO2 radiative forcing effects are in the bag.
In contrast to CO2, and of particular interest to me as a scientist, aerosol effects aren’t nearly as well understood. Look at the size of the error bars associated with the aerosol terms in the radiative forcing chart – comparable in size in one case and larger in the other than the magnitude of the terms themselves. It’s also worth noting that the radiative forcing effect of an aerosol is very sensitive to its physical and chemical characteristics as well as where it resides in the atmosphere. We kick up a lot of dust and as the climate changes we’ll likely kick up more and different flavors too. There’s work which needs to be done in order to reduce the uncertainty associated with aerosols in the Radiative Forcing Components figure above. From both a science and public policy standpoint, you’d really like to tighten up the aerosol effects estimates. Increasing CO2 concentration is an 800-lb gorilla with respect to climate change but we ignore aerosols at our peril. If anthropogenic effects (or natural effects, for that matter) cause aerosols to switch from being a net negative feedback to having a positive feedback, i.e., the go from having a cooling effect to having a warming effect, then Katie bar the door.
* See also a discussion of climate sensitivity here.